Pages

Showing posts with label carbon dioxide. Show all posts

Tuesday, August 11, 2015

Oceans in Distress


       When discussing climate change topics, we often focus our efforts and energy towards the depleting rainforests and the negative effects of overpopulated urban cities.  Rarely does our attention shift to one of the bigger players in the climate control space: our oceans.  These vast bodies of water cover over seventy percent of the Earth's surface.  Plentiful with marine life, the oceans' depths contain an unknown number of species still yet to be discovered.  And they're in trouble.


Wednesday, July 29, 2015

It is time to take action


Carbon dioxide and other global warming pollutants are collecting in the atmosphere like a thickening blanket, trapping the sun's heat and causing the planet to warm up.
As we know, global warming is a sign of climate change and our environment got damage. However, the United States Global Change Research Program concludes that climate change also poses unique challenges to human health such as:
  • Significant increases in the risk of illness and death related to extreme heat and heat waves are very likely. 
  • Some diseases transmitted by food, water, and insects are likely to increase.
  • Certain groups, including children, the elderly, and the poor, are most vulnerable to range of climate related health effects.
These effects will result in significant costs to our families and the economy. 

Take Action:
We can each play an important role in stopping climate change click here to help make a difference right now: http://www.nrdc.org/action/ and find more action ideas here: http://www.nrdc.org/globalWarming/gsteps.asp


By : Hanxiang Yu

Friday, July 17, 2015

We can't count on plants to slow down global warming


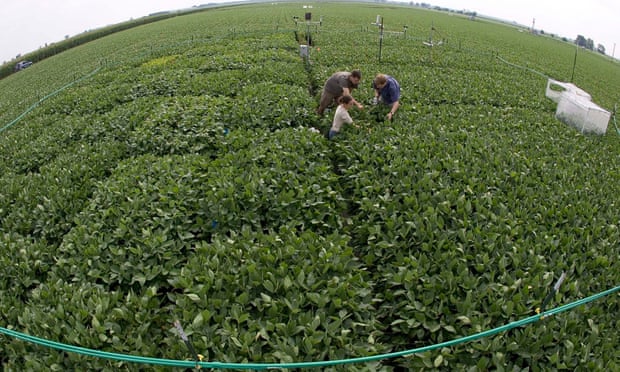
      A new study shows that plants growth from CO2 fertilization won't slow global warming. This means that we will not have that get-out-of-jail-free card that some of us were counting on.
      Increased CO2 in the atmosphere actually increased the out-flux of carbon dioxide from the soils. That is, it increased the rate of decomposition. In the long run, the increases in influx and out-flux will essentially balance out. This suggests that there will be little help from the biosphere for us humans-plants will not take up our emissions.
      Therefore, what do we need to do? What do humans need to do? This all goes to show that it is really up to humans, the emitters of greenhouse gases to take the lead on fixing the problem we started. The earlier we take action, the easier it will be.
       Don't you hope your children have a good life? Don't you want to your children notice how blue sky is? Don't you let your children know there are four seasons in one year? Join the action to slow down the climate change. Your little change will bring big difference.


To make a little change on yourself click it please: http://www.ecy.wa.gov/climatechange/whatucando.htm


By: Hanxiang Yu

http://www.theguardian.com/environment/climate-consensus-97-per-cent/2014/may/09/cant-count-on-plants-slowing-global-warming

Wednesday, February 29, 2012

Cartograms and Carbon Dioxide

What would a map of carbon dioxide emissions by country look like? Normally this map would have tones of the same color representing emissions. It might also have a piece of text explicitly stating the emission for each country. Another way to represent this is with a cartogram, a map that uses an attribute of the mapping unit for area instead of the physical land area. For carbon dioxide emissions, those countries with higher levels of emission would look physically bigger.

The Gapminder website contains public data for cumulative carbon dioxide emissions since 1751 and the total emissions for each year. When plotted on a cartogram it is a simple matter to see where emissions are coming from. This map was generated in ArcGIS software using a custom cartogram toolset.


Which countries have the greatest cumulative emissions? What about regions, such as Western Europe? Which nations had the highest emissions in 2004?

As you can see, cartograms are a good way of producing bivariate maps. Yet, what if we want to see this change over time? Click play here to see how this is done on the Gapminder website.