Pages

Showing posts with label emissions. Show all posts

Wednesday, July 29, 2015

Climate Change and Human Health


When we hear about climate change, the first thing that comes to our minds is environment, animals, plants, and earth temperature. However, we always miss another important part that would suffer from this issue as well as other living creatures. Humans health can be affected by climate change through  a variety of pathways, for instance as a result of increased frequency and concentration of heat waves, , increased floods and droughts, changes in the distribution of vector-borne diseases and malnutrition. Climate change is a very critical public health issue that is affecting and will affect a wide majority of people around the world.  Children, elderly people, the poor, and those with fundamental health condition are the most vulnerable people for health effect from climate change. 
Although the impacts of climate change have the potential to affect human health in the United States and around the world, there is a lot we can do to prepare for and adapt to these changes. All public health and global health organizations and local agencies are collaborating together in order to support development of healthy cities that are prepared for climate change. One of the adaptation methods that are used to reduce climate change effect is planning urban adaptation strategies by planting trees to minimize heat buildup in cities and manage storm water, or promoting the use of cool roofs to reduce energy needs and improve air quality. But what can normal people do to protect their health?

We can do many things in order to reduce climate change effects by simply reducing greenhouse gas emissions. Planting your garden or your neighborhood would make a different and would make your surrounding much healthier.  Donating for global health agencies to improve low income countries environment would increase the possibilities to save others lives.

Sunday, July 19, 2015

Drive less, drive differently


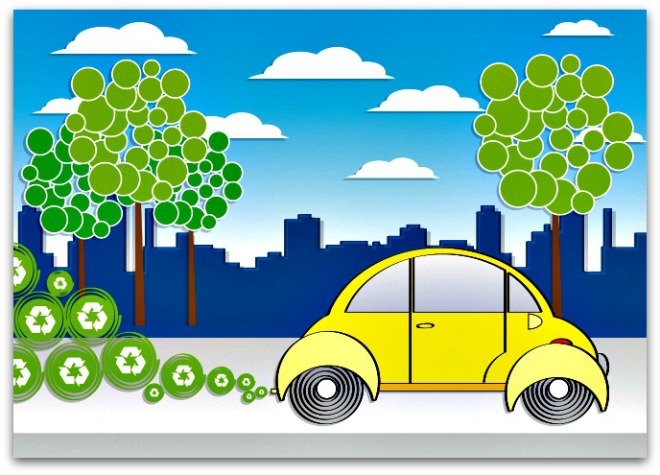
You may think that your efforts in reducing climate changes are useless. But what you don’t know is any little green changes in your life will definitely have impacts on people around you and on earth as well. One of these changes would be driving your car less or even driving it differently.  The truth is that your car produces a high amount of carbon dioxide (CO2).  If you still want to drive you can pay more attention to fuel efficiency in your car which may be the single biggest thing you can do to prevent climate change.  Replacing your gas-guzzling car with a fuel-efficient one is by far the best thing you can do, out of all your choices. Or simply, you can slow down, don't race your car's engine, and watch your usage. All of these save on gas – and of course saving you money- and have a big impact on burning gasoline.

On the other hand, what you can do is to drive less. Walk or ride a bicycle for short trips, or take public transportation for longer ones. Several studies have shown that people who use public transportation are healthier than those who don’t. Moreover, families that use public transportation can save adequate money annually to cover their food costs for the year. Those were simple options to help reducing climate change that will not harm you but would defiantly make your life healthier and save the earth from another perspective. 

Read more:

Monday, February 11, 2013

Wednesday, February 29, 2012

Cartograms and Carbon Dioxide

What would a map of carbon dioxide emissions by country look like? Normally this map would have tones of the same color representing emissions. It might also have a piece of text explicitly stating the emission for each country. Another way to represent this is with a cartogram, a map that uses an attribute of the mapping unit for area instead of the physical land area. For carbon dioxide emissions, those countries with higher levels of emission would look physically bigger.

The Gapminder website contains public data for cumulative carbon dioxide emissions since 1751 and the total emissions for each year. When plotted on a cartogram it is a simple matter to see where emissions are coming from. This map was generated in ArcGIS software using a custom cartogram toolset.


Which countries have the greatest cumulative emissions? What about regions, such as Western Europe? Which nations had the highest emissions in 2004?

As you can see, cartograms are a good way of producing bivariate maps. Yet, what if we want to see this change over time? Click play here to see how this is done on the Gapminder website.